US Doppler Radar HD


US Doppler Radar at weather.us
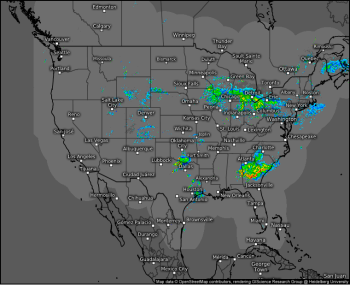
Where is it raining right now? With our high resolution HD radar, you can see exactly where precipitation is falling, whether it’s rain, hail, sleet, or snow. The SD radar composite isn’t quite as precise, but it will show you an overview of precipitation across an entire region, and will be a good indicator of where the heaviest precipitation is falling generally.
Radar cannot show clouds, it only picks up precipitation. It also doesn’t discriminate directly between rain, snow, or other precipitation types. However, there are some tricks you can use to make an educated guess about what might be falling. Extremely heavy precipitation (values on the radar above 60dBz) is almost always a result of hail. It’s very very hard to pack raindrops close enough together to get a value like that, so if you see those values, hail is a decently good bet. As for rain vs snow, snow is made of crystals which are dispersed more easily by the wind. That means that areas of heavy snow will be “fuzzier” on radar as the snowflakes that form in the heavy band get blown around a little outside the band. Compare this to rain bands, which will often have sharper edges.
While radar is a really good approximation of where precipitation is falling, it’s not perfect. It can both over and under-estimate the extent of precip due to an inherent problem with how radar works. Radar works by sending a signal out in a straight line from the radar station through the atmosphere. As that signal gets farther away from the origin station, the earth’s curvature means that the signal becomes higher and higher off the ground (think of drawing a straight line out from any point on a circle). Therefore, the radar doesn’t perfectly reflect what is happening on the ground. It can overestimate precip by picking up on rain or snow that exists aloft, but is evaporating before it hits the ground. It can also underestimate precip by missing low level precip that’s far from the radar and doesn’t get “tall” enough to be seen by the signal.
Where will it rain in the next few hours? Our model forecast simulated radar maps are a good place to start in determining what the radar might look like a few hours from now. Keep in mind these maps are often most accurate for areas of stratiform (steady) precipitation that are big enough for the models to see. Situations with thunderstorms are much harder to predict because new cells could pop up at any time, and existing cells could dissipate.


Where are thunderstorms located and where are they going? Our storm tracking tool shows where there are currently strong showers or thunderstorms, about how strong they are, and where they are moving. The storm tracking tool extrapolates current cell tendencies, so use it with appropriate caution. It is usually quite good, but in some cases cells change direction which can trip up the algorithm. The cells on the map are colored by severity. The map is reanalyzed every 5 minutes.
What is the current danger of tornadoes? Our doppler radar product shows how fast winds are blowing in a storm either towards or away from the radar site. Tornadoes are a very strong circulation, meaning they have strong winds moving towards the radar very close to strong winds moving away from the radar. If you see a “couplet” like this, you’ll know to watch out for a tornado. The stronger the couplet, the more likely a tornado is in that area. Note that because the radar beam gets farther off the ground as you move away from the radar station, the beam will only sample a storm’s mid level circulation (known as a mesocyclone) which may or may not extend far enough down towards the ground to produce a tornado.
How tall are the thunderstorms? With our echo tops product, you can see how far up into the atmosphere a thunderstorm extends. This can be important for predicting hail because the taller a thunderstorm is, the more likely it is to produce large hail. Taller storms are also generally much stronger overall and have a higher likelihood of producing heavier rain, lightning, and strong winds.
Radar derived precipitation totals
This product displays radar derived precipitation estimates that are calibrated using actual rain gauge observations. This is helpful because radar data has some important shortcomings. The algorithm used to display the radar-derived precipitation data assumes the radar beam is intercepting every bit of falling precipitation and that every bit of precipitation intercepted by the radar beam makes it to the ground. Both of these assumptions are valid near the radar however they become progressively less true as you head farther away from the radar tower and higher up into the atmosphere. Rain gauge observations help fill this gap and turn unreliable data into information you can depend on.
Alabama Arizona Arkansas California Colorado Connecticut Delaware Florida Georgia Idaho Illinois Indiana Iowa Kansas Kentucky Louisiana Maine Maryland Massachusetts Michigan Minnesota Mississippi Missouri Montana Nebraska Nevada New Hampshire New Jersey New Mexico New York North Carolina North Dakota Ohio Oklahoma Oregon Pennsylvania Rhode Island South Carolina South Dakota Tennessee Texas Utah Vermont Virginia Washington Washington, D.C. West Virginia Wisconsin Wyoming